Space DOTS Whitepaper
Space Environment Intelligence for a Congested and Contested Orbital Economy
Version 1.8 -- Executive Draft
04/03/2026
- Executive Summary
- Blind Spots in Operational Orbits
- Why existing solutions don't close the gap
- Space DOTS Architecture
- DataDOT-1
- Commercial Implications / Use Cases
- Appendix A: Industry Context and References
- Appendix B: Key DataDOT-1 specification
- Appendix C: Key DataDOT-2 specification
Executive Summary
Orbit has become critical commercial infrastructure.
As of 2025, more than 9,000 active satellites support global telecommunications, positioning and timing services, defence communications, financial transaction synchronization, Earth observation, climate analytics, logistics optimization and broadband connectivity. The majority of these assets have been launched within the past five years. Industry projections anticipate tens of thousands more by the early 2030s.
Low Earth Orbit is no longer a scientific frontier. It is an operational layer underpinning global economic activity.
Yet the physical environment in which this infrastructure operates remains materially under-measured
Satellite operators today rely on a fragmented patchwork of upstream solar monitoring, sparse scientific missions, legacy empirical thermospheric models, and coarse debris tracking. There is no commercially operated, distributed, in-situ environmental intelligence layer measuring radiation flux, magnetic perturbation, thermospheric density variability, particle energy spectra, and RF disturbance at scale across LEO, MEO, GEO and emerging VLEO regimes.
The consequence is structural inefficiency.
Environmental uncertainty drives conservative engineering decisions, excess shielding mass, redundant subsystems, wide operational margins, and defensive safe-mode responses during solar events. These protective measures increase capital cost, reduce uptime, and compress margins across proliferated constellations.
At the same time, anomaly attribution remains ambiguous. When a satellite fails or degrades, operators and insurers must determine whether the cause was environmental stress, supply chain weakness, operational error, collision, or malicious interference. Without contextual environmental telemetry, causation analysis is probabilistic rather than evidence based. This ambiguity affects warranty claims, insurance adjudication, supplier accountability, and strategic escalation decisions in contested domains.
As constellation density increases and orbital services become embedded within terrestrial economies, environmental uncertainty becomes a balance sheet issue.
Space DOTS addresses this structural gap by deploying a distributed network of physical and virtual environmental sensors, integrated with AI-driven thermospheric density modelling and cross-sensor attribution analytics, delivered securely through the platform Space DOTS provides
The result is a new operational layer: Space Environment Intelligence.
This layer enables:
• Improved trajectory and drag prediction through reduced thermospheric model error, enabling more accurate orbit determination and manoeuvre planning.
• Optimized station-keeping, fuel efficiency and propulsion system preservation -- reducing premature thruster degradation caused by unmodelled drag variability.
• Higher service uptime during space weather events and environmental disturbances, minimising operational disruption.
• Disciplined attribution of anomalies and subsystem degradation through cross-sensor environmental correlation.
• Enhanced underwriting precision and reduced claims ambiguity through quantifiable environmental causality.
• Stabilized decision-making in defence and sovereignty contexts through trusted environmental intelligence.
As orbital infrastructure scales, resilience and asset longevity will depend not only on access to launch, but on quantified and qualified understanding of the environment itself.
Space DOTS positions itself as the environmental intelligence layer underpinning the next phase of the orbital economy.
Blind Spots in Operational Orbits
The space environment is not static, and it is not benign. Spacecraft are continuously exposed to variable radiation flux, fluctuating thermospheric density, mag-field perturbations, ionospheric disturbances and more.
Space Domain Awareness today focuses primarily on tracking objects. Space weather forecasting focuses largely on upstream solar observation from L1 and limited heliophysical missions. Neither provides continuous, high-resolution, in-situ measurement of environmental conditions across operational altitudes.
The consequence of this is not one, but two issues. The first is a forecasting problem: without
Forecasting
Thermospheric density remains a particularly critical space environmental parameter for low-altitude spacecraft. Density directly influences drag, orbital decay, conjunction analysis, and re-entry prediction. Operators depend on empirical legacy models such as NRLMSISE-00 and Jacchia-Bowman, which typically operate with 40 to 60 percent mean absolute percentage error under variable solar conditions. These models are used for manoeuvre planning, flight dynamics etc, are built on sparse historical data and perform acceptably under quiet solar conditions. They were not designed for the operational precision modern spacecraft management requires.
This is why operators frequently default to conservative mitigation strategies during solar events. Satellites may enter safe mode or reduce operational activity. While protective, such responses reduce service uptime and commercial revenue.
The February 2022 Starlink made the cost of this gap tangible: SpaceX lost 38 of 49 newly launched Starlink satellites following a geomagnetic storm^1. The atmospheric density at deployment altitude increased by about 20-50% above the forecast, resulting in higher drag forces than expected -- even though the storm itself was classified as 'moderate' or 'minor'. This resulted most of the satellite batch to re-enter causing SpaceX a financial loss of an estimated 50-100 million USD^2. The root cause here was not the engineering or operational failures -- it was the models used to predict the post-launch environment.
Measurement
The forecasting gap described in the previous section is a symptom of a deeper measurement problem. Estimates such as thermospheric density cannot be observed from ground directly but need to be measured in situ. Scientific missions like CHAMP, GOCE, GRACE and Swarm have provided most valuable datasets on the density front, however they were designed for geophysical research, not operational environment monitoring. Their data is of high quality, but spatially sparse, temporally discontinuous and optimised for post-processing rather than real-time use.
Space Weather forecasting infrastructure is similarly constrained, whereby upstream monitoring capabilities (like ACE at L1) provide solar wind observation approx. 15-60minutes before arrival at Earth. This is useful for broad event warnings, but not sufficient for characterising conditions at specific orbits once a solar event interacts with the magnetosphere and atmosphere. The chain of events between solar wind input to our local system, and the localised density perturbations involves complex and poorly constrained dynamics that upstream observations alone cannot resolve. The result is a blind spot at a location where commercial and defence spacecraft operate.
In short: operators receive general event warnings, but lack in-situ measurements of environmental conditions at their spacecrafts position.
Attribution
Environmental measurement is also an attribution problem. Satellite anomalies like degraded performance, unexpected power fluctuation, navigation errors, subsystem failures can occur quite frequently. Potential causes include radiation-induced single event effects, thermospheric perturbation, component weakness, operational errors or even proximity interference, jamming or spoofing. Without environmental telemetry at the time and location of the anomaly, distinguishing between these causes is basically probabilistic. In a commercial context this can delay warranty resolution or cause insurance claim complications. In defence contexts, being unable to rule out natural environmental causes before attributing such anomaly to adversarial interference, can carry a meaningful risk of miscalculation.
As operational spacecraft density increases and orbital infrastructure becomes embedded in critical services, this ambiguity compounds. More satellites mean more anomalies, and more anomalies without clear attribution means more conservatism, more disputes, and more unresolved operation risk across a fleet of satellites.
In summary the orbital environment is very variable, at times hard to predict and undermeasured at altitudes that matter. Existing forecasting models carry errors that translate directly into lifetime reduction, fuel waste and as we have seen with the Starlink event, to fleet-level economic exposure.
Existing measurement infrastructure was not designed for operational density or real-time use. The absence of in-situ environmental telemetry leaves operators, insurers, and sovereign actors making decisions under uncertainty that is, in principle, resolvable, and that distinction between unavoidable and unaddressed is where the commercial case for Space DOTS begins.
Why existing solutions don't close the gap
The infrastructure for monitoring the space environment divides into broadly three categories: upstream solar observations, science missions and commercial data services. Each provides valuable information and assets; however, none were designed for what modern operational spacecraft or constellation management requires.
Upstream forecasting services like NOAA SWPC, the UK Met Office MOSWOC etc. are built around L1 solar wind observation and ground-based sensing. They are good at what they were designed for: event-level warnings, storm classifications, broad geomagnetic activity indices. The February 2022 Starlink loss happened during a storm that these services correctly identified and warned about. The failure was downstream of the warning, in the density models used to translate a geomagnetic event into a drag forecast at a specific altitude. That translation problem is not one that better upstream observation solves.
Scientific in-situ missions like Swarm, COSMIC-2, and their predecessors have produced the most valuable environmental datasets we have. The empirical models operators rely on today were built from this data. But a handful of research spacecraft on fixed orbital planes cannot provide environmental context across a distributed commercial constellation, and their data pipelines were never intended to feed operational flight dynamics software in anything close to real time. Scientific missions are the foundational layer, not directly translatable into operational inputs.
Commercial providers like Spire have really moved the needle on ionospheric characterisation via GNSS radio occultation at scale, and their data latency is meaningfully better suited to commercial use than science missions. But RO is a specific technique with a specific measurement geometry; it profiles the ionosphere well, but does not capture radiation flux, magnetic perturbations or thermospheric density variations (which as we remember drive drag). And SDA providers like LeoLabs track objects with increasing precision without characterising the environment those objects are flying through.
In summary the gap isn't that these systems are inadequate at what they do, but none of them were built to provide localised, multi-parameter, in-situ environmental measurements at a cadence that is useful to operators of commercial spacecraft.
That capability doesn't exist yet in a form that integrates into commercial workflows, which is the specific problem SpaceDOTS is addressing.
Space DOTS Architecture
SpaceDOTS deploys a layered sensing architecture combining physical measurement nodes, environmental modelling and a data access layer designed for integration into operational workflows. Rather than relying on a small number of expensive, dedicated scientific missions. The approach combines compact in-situ sensing nodes, piggybacking of commercial host-spacecraft, with signals derived from operator telemetry. This set of measured and 'virtual' data sets is fed to the intelligence platform for aggregation, fusion and modelling.
A deliberate design requirement across all layers is measurement independence. Operator-provided telemetry, no matter how detailed, cannot serve as neutral evidentiary context in attribution decisions, regulatory proceedings or even insurance claims because it originates from a party with a direct interest in the outcome. Space DOTS data is collected by an independent network operating across multiple spacecraft and multiple operators, none of whom control the measurement. That independence is what makes the data usable in contexts where provenance matters.
Physical Sensing: DataDOT
At the physical layer, SpaceDOTS provides DataDOT's - sub-0.5U, 0.4kg sensor packages designed for low (c)SWaP integration aboard a host spacecraft. The design philosophy is deliberately conservative: using proven COTS components, low integration and administrative burden (ITAR-free) and a power envelope that makes hosting a straightforward decision for integrators and operators.
This creates a dependency on the host-spacecraft resource availability in terms of Power, Operational time and downlink bandwidth, but it equally allows operators easy data access.
A first baseline demonstrator DataDOT-1 (DD-1) has been successfully deployed in 2025 aboard a D-Orbit spacecraft and has been providing data over the span of the operational lifetime. The goal was to establish a core mechanical and electrical architecture to allow fast future iterations for novel sensors as they become available, as well as develop the data ingestion infrastructure.
Currently, DataDOT-2 (DD-2) is being integrated with a heavily improved set of sensing capabilities, taking into account lessons learned during the first mission.
In a nutshell, the following direct measurements are taken by the DataDOT-2:
| Sensor | Measurements | Derived Products | Status |
|---|---|---|---|
| GNSS Receiver | Pseudorange, carrier phase, C/N0, PVT | TEC, ionospheric density maps, atmospheric density estimates | DD-2 (26Q3) |
| Particle Detector | Particle flux, energy spectrum, LET, particle track imaging | Particle classification, SEP event characterisation, energy deposition analysis | DD-2 (26Q3) |
| Dosimeter | Dose rate, TID, alarm events | TID accumulation, event flags | DD-1 (25Q1) DD-2 (26Q3) |
| Accelerometer | 3-axis accel | Drag event context, density estimation support | DD-1 (25Q1) DD-2 (26Q3) |
| Magnetometer | 3-axis B-field | Geomagnetic event characterisation | DD-1 (25Q1) DD-2 (26Q3) |
| Thermal Sensors | Multi-point temperature | Payload health, thermal environment context | DD-1 (25Q1) DD-2 (26Q3) |
These sensors have been chosen specifically to address some of the main drivers such as the thermospheric (neutral) density estimation as well as a more nuanced radiation environment other than simple dosimetry.
A particular concern from spacecraft operators is the resource usage of payloads/sensors, which DataDOTs address by providing intelligent power management and different 'Modes of Operation'. The two main modes are a continuous Low Power Mode, where the total power draw is reduced to about 0.3W OAP and data is stored locally onboard the payload (for up to a few weeks of independent operation from the host s/c in terms of data).\ The Normal -- or 'Performance' Mode -- draws up to 5W but provides a higher quality dataset as well as much higher sampling frequencies.
Switching between Low and Performance Mode can be done manually (via operator or timeline) or autonomously by allowing the DataDOT to identify a change in local environment and act on it. For example, changes in total dose rate or big drops in ND estimation allow triggering the Mode-Switch.
A major obstacle with having high quality sensors, such as Particle detectors is the sheer amount of data that gets generated and easily saturates an operators bandwidth after only a few hours of operation.
DataDOT's onboard processing managed this data volume by autonomously down selecting to data regions that are of interest. This 'edge' processing capability specifically for the radiation and GNSS data is currently being development together with the SWIMMR (RAL Space) team as part of the ESA SEISMIC project.
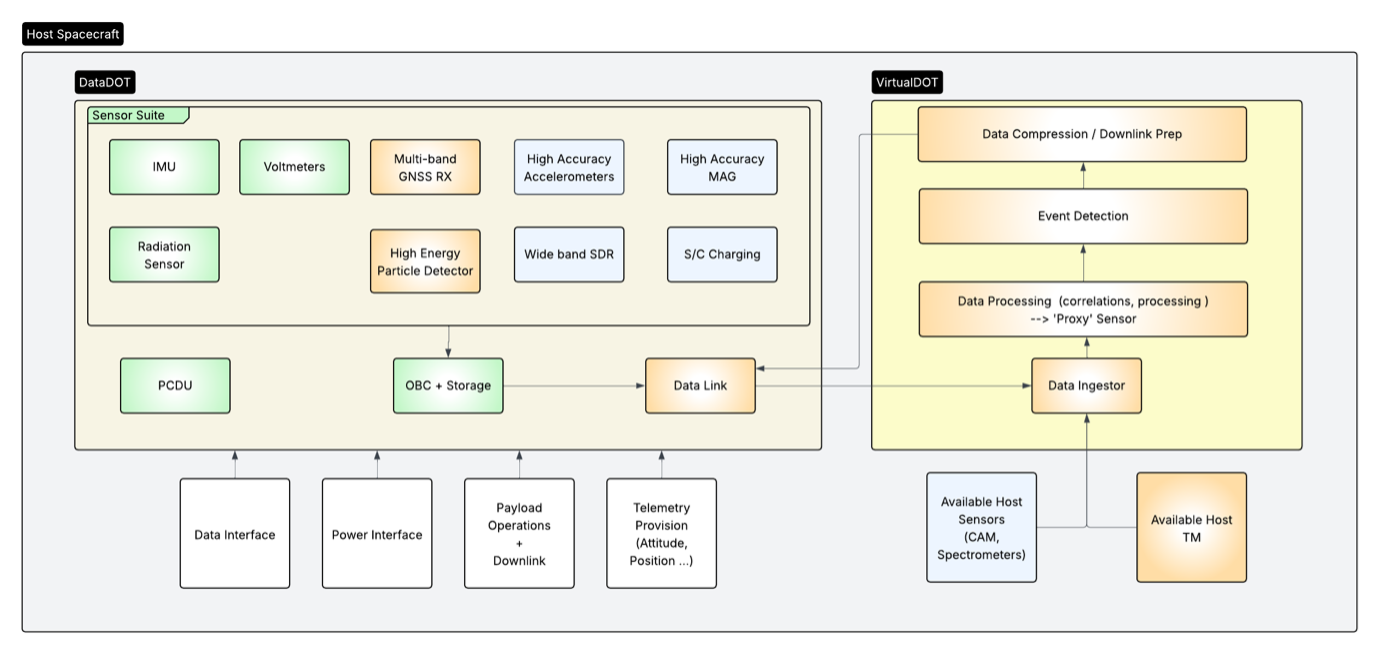
The 'Edge' processing of collected data sets allows to drastically reduce downlink by providing derived data products, that do not require a full set of raw data downlink.
The following table shows the data products available with the DataDOT-2:
| Derived Data Product | Source | Description |
|---|---|---|
| PVT Vectors | GNSS observables | Position, Velocity, Time solution |
| TEC & TEC Maps | GNSS dual-frequency | Total Electron Content Ionospheric density mapping |
| Total Ionising Dose | Radiation detector integration | Accumulated TID over mission Dose rate integration |
| Particle Track Imaging & Classification | Imaging radiation detector | Particle identification (e⁻, p⁺, ions) Energy deposition analysis Track reconstruction |
| SEP Event Characterisation | Radiation flux analysis | Solar Energetic Particle detection Event onset & intensity Energy spectrum evolution |
| Atmospheric Density estimates | GNSS | Orbital decay analysis On-board drag estimation Density estimation supported by accelerometry (no direct measurement) |
| Space Environment Event Detection | Multi-sensor fusion | Geomagnetic storm detection Radiation belt boundary crossings Anomaly correlation |
Virtual Sensing
The DataDOT physical measurement layer is not SpaceDOTS' only source of environmental information. Host platform operators routinely collect timestamped housekeeping data containing latent environmental signatures. Examples include Single-Event Effect counts and error correction rates in memory and storage, voltage fluctuations or anomalies on power rails, RF noise fluctuations and thermal excursions beyond design bounds. Traditionally these are seen as engineering health metrics, however collected and correlated across multiple spacecraft at the same orbital altitude and time they effectively become environmental telemetry.
This is significant beyond just the data it produces; it means that every spacecraft operator who shares housekeeping data extends the effective sensing network without flying additional hardware. The cost of adding such a proxy sensing node is essentially zero, once the data sharing agreement exists. This is the mechanism by which SpaceDOTS sensing density can scale ahead of its hardware deployment rate.
This proxy-based approach is currently being validated with an R&D activity on DataDOT-2, that provisions an on-board correlation between radiation detector measurements and radiation-induced effects observed in specific electronics components. Demonstrating this correlation between a known environmental input and the resulting predictable/measurable proxy signature in orbit is a required step to validate proxy telemetry as a credible environmental data source.
The long-term objective is to enable low-cost DataDOT variants that can operate primarily through proxy telemetry rather than dedicated sensors, which in turn reduces integration burden for host operators. It also helps accelerating network growth
Environmental Modelling
SpaceDOTS' environmental intelligence capability is significantly enhanced through a partnership with Trillium, who provides a data-driven thermospheric model derived from data from CHAMP, GOCE, GRACE and SWARM missions. Their machine-learning based model provides now- and forecasting for thermospheric density at an accuracy of approximately 20% MAE^3, which outperforms legacy empirical models significantly under variable solar conditions, compared to 40-60% typical of NRLMSISE-00 and JB-08 under the same conditions. DataDOT observations can feed into this model as additional inputs to improve localised nowcast accuracy as network density grows.
Data Access
All data products are delivered through the SpaceDOTS API, structured for programmatic consumption and ease of integration into existing operational tools such as flight dynamics software, conjunction analysis pipelines or anomaly investigation workflows.
The initial evaluation dataset available through API v1 consists of DataDOT-1 magnetometer and dose rate data from operations in sun-synchronous LEO in 2025 (550km with orbit raising to 1200x300km), alongside third-party environmental data products. DD-1 was an infrastructure demonstration for evaluation purposes to confirm end-to-end pipeline integrity and enabling integration work to begin ahead of DD-2 operations. DataDOT-2, launching late 2026, will provide the operational dataset with the data products as described in above sections. The evaluation programme is designed so that integration is already complete and commercial relationships already established by the time the full sensor suite is online.
DataDOT-1
DataDOT-1 flew aboard a D-Orbit ION spacecraft in SSO in 2025, operating on a roughly weekly cadence for 7 months, culminating in a total of 72 hours of 1Hz sensor data. The mission was scoped explicitly as an infrastructure demonstration whereby the objective was to validate end-to-end data flow from sensor acquisition through onboard storage, ground downlink, pipeline processing, and API delivery, not to produce a science dataset.
The pipeline performed as designed, data arrived in the expected format, and the processing chain handled the full sequence. That is the result that matters for API v1: any operator evaluating integration can do so against a pipeline that has been exercised in orbit, not just on the ground.
Dose rate measurements were taken in regions of particular interest, like polar orbits or the SAA, with their respective expected characteristics such as westward drift of the anomaly visible. The resulting data is currently being evaluated in conjunction with SWIMMR based particle measurements as part of an ESA PhiLab project.
The data confirms the dosimeter is responding to the actual radiation environment rather than noise. Initial examination also shows early correlation structure between the magnetic field measurements and dose rate variations consistent with known relationships between geomagnetic field strength and trapped particle flux. Further correlation analysis is ongoing.
The sensor suite was minimal with a short operational window and data quality reflects the realities of a first integration on a host platform. The specific lessons from DD-1 directly informed the DD-2 sensor selection, integration architecture, and onboard processing design. However, that iteration path is precisely the approach taken with the DataDOT's: DD-1 established the infrastructure with the follow-on DD-2 delivering the sensing and edge processing capability.
ESA Phi-Lab: SEISMIC
The SEISMIC project is a collaboration between Space DOTS and the RAL Space SWIMMR team, supported through ESA Phi-Lab. It has two main connected objectives.
The first is data validation. DD-1 and the RAL Space SWIMMR particle sensor^4 flew aboard the same D-Orbit spacecraft in 2025, providing a unique opportunity to cross-correlate Space DOTS dosimeter measurements against an independent, calibrated particle detector at the same orbital position and time. This cross-correlation work directly strengthens the evidential basis for DataDOT measurements as an environmental data source.
The second is capability development. Working with the RAL Space team, Space DOTS is developing onboard edge processing approaches for future DataDOT generations. The objective is to reduce raw data volume without sacrificing scientific utility which is a practical requirement for any sensor operating within the power and bandwidth constraints of a hosted payload architecture. The outcomes of this work will inform sensor selection and processing architecture for DataDOTs beyond DD-2.
The SEISMIC engagement reflects a broader principle in how Space DOTS approaches capability development: partnering with established scientific institutions to validate measurements and develop processing approaches, rather than building in isolation.
Commercial Implications / Use Cases
The three outlined use cases below (spacecraft operations, insurance and defence) address different problems in different organisational contexts, but what connects them is attribution.
Each use case depends in some form on the ability to determine what caused an event, whether navigational degradation or event resulted from the environment, model error and had natural or adversarial causes, whether a satellite failure was radiation induced of a component defect, attribution requires environmental context that is independent and localised, which is what SpaceDOTS is aiming to provide and which is why the underlying dataset for above use cases has operational relevance across all three domains.
Operators: Flight dynamics and drag management
Atmospheric drag is the dominant perturbation force below 600 km and the primary driver of propellant consumption for station-kept constellations. Every operator running a flight dynamics pipeline today is ingesting density forecasts from empirical models whose limitations under active solar conditions are well documented, about 40 to 60 percent mean absolute error when the environment is most dynamic and operational stakes are highest. That error doesn\'t stay in the model. It propagates into manoeuvre planning conservatism, wider conjunction screening thresholds, and propellant reserves sized to absorb uncertainty rather than actual drag. On a single spacecraft the inefficiency is manageable. Across a large constellation it becomes a structural cost embedded in every fuel budget and every end-of-life projection.
In-situ density measurement tightens that feedback loop. A DataDOT node at operational altitude provides density observations that can be assimilated into drag models in near real-time, reducing the gap between forecast and actual conditions at the specific altitudes and times that drive manoeuvre decisions. During geomagnetic events, where empirical model error is largest and the temptation to enter safe mode is highest, localised in-situ data provides the environmental context that upstream solar wind observation cannot resolve on its own. That context feeds into the Trillium density model through the SpaceDOTS platform API, improving nowcast accuracy in the conditions where it matters most.
The outcome is operational rather than academic: tighter manoeuvre margins, more accurate conjunction screening, and propellant budgets that reflect the environment the spacecraft is actually flying through. For operators in VLEO, where density variability is most acute and drag management most demanding, that precision compounds directly into mission lifetime.
Insurance and Risk transfer
When a satellite anomaly occurs, the first question an insurer asks is what caused it. The candidate list is long, from radiation-induced single event effects, thermospheric perturbation, a component that failed earlier than its qualification suggested, an operational decision that turned out to be wrong, or something external and deliberate. Without independent environmental data from the time and location of the event, working through that list is largely probabilistic. Operators provide their own telemetry, which is detailed but not disinterested. The result is claims-cycles that run longer than they should, disputes that are harder to resolve than they need to be, and reserve margins sized to absorb ambiguity that is, in principle, resolvable.
Space DOTS provides the independent reference layer that changes that dynamic. If radiation flux was elevated at the time and location of the anomaly, environmental causation becomes evidentially supportable. If conditions were nominal, the investigation moves elsewhere with confidence rather than uncertainty. Because the data comes from a distributed network spanning multiple operators, none of whom have a stake in any individual claim, it carries a provenance that operator telemetry cannot. For underwriters building that reference into causation frameworks, the same dataset also improves risk segmentation: a constellation operating in a well-characterised radiation environment is a different underwriting proposition from one operating in an unmeasured one.
Defence and sovereignty
The ability to distinguish natural environmental disturbance from deliberate interference is a precondition for a disciplined response in a contested domain. A communications degradation or navigation anomaly that occurs during a geomagnetic storm has a plausible natural explanation. The same event under nominal environmental conditions does not. Acting on the wrong conclusion in either direction carries real consequences, and without independent environmental telemetry the distinction often cannot be made with confidence.
Space DOTS provides the environmental context layer that makes that distinction possible; verified radiation flux, magnetic perturbation, and ionospheric disturbance data at the time and location of an anomaly, drawn from a network that no single sovereign actor controls. The current focus is on establishing that measurement baseline. The longer-term architecture roadmap includes data handling and provenance controls aligned with defence requirements, but the environmental layer itself is what sovereign users need regardless of how the security architecture around it evolves.
Appendix A: Industry Context and References
1. Union of Concerned Scientists Satellite Database, 2024--2025 update.
2. BryceTech, "Smallsats by the Numbers," 2024.
3. ESA Space Debris Office Annual Report, 2024.
4. NOAA Space Weather Prediction Center publications, 2023--2025.
5. UK Met Office Space Weather Operations Centre documentation.
6. NASA NRLMSISE-00 Atmospheric Model documentation.
7. Jacchia-Bowman 2008 atmospheric density model references.
8. CHAMP, GOCE, GRACE, SWARM mission datasets.
9. US Space Force and UK Space Command public briefings, 2023--2025.
10. Outer Space Treaty (1967) and Liability Convention (1972).
11. Berger, T.E. et al. (2023). \"The Thermosphere Is a Drag: The 2022 Starlink Incident.\" Space Weather, 21. https://doi.org/10.1029/2022SW003330
12. Dang, T. et al. (2022). \"Unveiling the space weather during the Starlink satellites destruction event on 4 February 2022.\" Space Weather, 20, e2022SW003152. Also: SpaceX official statement, 8 February 2022. https://www.spacex.com/updates/
13. Acciarini, G. et al. (2024). \"Improving Thermospheric Density Predictions in Low‐Earth Orbit With Machine Learning.\" Space Weather. https://doi.org/10.1029/2023SW003652
Appendix B: Key DataDOT-1 specification
| Parameter | Specification |
|---|---|
| Form Factor | 0.3 - 0.4 U (depends on configuration) |
| Dimensions | 90×70×30-40mm (depends on configuration) |
| Mass | 370g - 520g |
| Data Interface | CAN, RS485/RS422 |
| Power Interface | 5V - 12V |
| Consumption (Normal Mode) | 3-4.5W (max 5W) |
| Consumption (Low Power Mode) | 0.3W (max 0.8W) |
| Calibrated Op Temperature Range | 10 to +40 °C |
| Extended Op Range (with thermal conditioning) | -25 to +40 °C |
| Survival Temperature | -25 to +70 °C |
| Data Volume | 2 to 50MB / day (configurable) |
| Sensor System | Measurements | Specifications |
|---|---|---|
| Dosimeter | Dose rate Total Ionizing Dose Radiation alarm events |
Range: 0.01 to 9000 μSv/h Energy: ~0.2-10 MeV (gamma) Alarm threshold: 40 μSv/h Update rate: 10s & 60s |
| Accelerometer | 3-axis acceleration | ±2/4/8 g selectable range Noise density: 22.5 µg/√Hz 0g offset drift: ±0.15 mg/°C (supports large drag anomaly detection, no direct measurement of drag forces) |
| Magnetometer | 3-axis magnetic field vector | Range: ±800 µT Vector field components (Bx, By, Bz) Continuous low-power monitoring |
| Thermal Sensors | Multi-point temperature monitoring | Distributed sensor array |
Appendix C: Key DataDOT-2 specification
| Parameter | Specification |
|---|---|
| Form Factor | 0.3 - 0.4 U (depends on configuration) |
| Dimensions | 90×70×30-40mm (depends on configuration) |
| Mass | 370g - 520g |
| Data Interface | CAN, RS485/RS422 |
| Power Interface | 5V - 12V |
| Consumption (Normal Mode) | 3-4.5W (max 5W) |
| Consumption (Low Power Mode) | 0.3W (max 0.8W) |
| Calibrated Op Temperature Range | 10 to +40 °C |
| Extended Op Range (with thermal conditioning) | -25 to +40 °C |
| Survival Temperature | -25 to +70 °C |
| Data Volume | 2 to 50MB / day (configurable) |
| Sensor System | Measurements | Specifications |
|---|---|---|
| GNSS Receiver | Pseudorange observables Carrier phase C/N0 (signal strength) PVT solution |
Multi-constellation (GPS/Galileo/GLONASS) L1/L5 dual-frequency Raw observables output |
| Particle Radiation Detector | Particle flux & energy spectrum Linear Energy Transfer (LET) Dose rate Particle track imaging |
Particle types: e⁻, p⁺, heavy ions Imaging detector (pixel array) Energy range: keV to MeV scale Angular & spatial resolution |
| Dosimeter | Dose rate Total Ionizing Dose Radiation alarm events |
Range: 0.01 to 9000 μSv/h Energy: ~0.2-10 MeV (gamma) Alarm threshold: 40 μSv/h Update rate: 10s & 60s |
| Accelerometer | 3-axis acceleration | ±2/4/8 g selectable range Noise density: 22.5 µg/√Hz 0g offset drift: ±0.15 mg/°C (supports large drag anomaly detection, no direct measurement of drag forces) |
| Magnetometer | 3-axis magnetic field vector | Range: ±800 µT Vector field components (Bx, By, Bz) Continuous low-power monitoring |
| Thermal Sensors | Multi-point temperature monitoring | Distributed sensor array |